 Live data visualizations will open a new era for graphic design and corporate communication.
“With the year 2020, graphic design trends have reached an important milestone,” asserts Jamahl Johnson at 99designs. “It’s the dawn of a new decade, and graphic design is poised to reach new heights as designers begin to define the era. There’s a feeling in the air that anything can happen — that we are about to witness the next evolution of graphic design as we know it.”
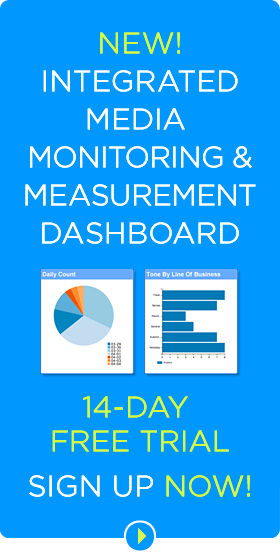
Live, or real-time, data visualizations, change immediately in response to new data, enabling continual updating of dashboards. The idea, he says, is similar to visualizations on music apps like Windows Media Player that convert soundwaves into abstract graphics.
“In 2020, complex live data—like dashboard stats—will become even more immediately available, and designers will need to showcase information in a way that adapts to changes and dynamically animates,” he states.
Designers favor a distinctly digital look with dark interfaces, heavy blues, abstract polygons and typography reminiscent of VHS technology, Johnson says. The style combines other current graphic design trends, such as neon color schemes, organic geometry and dynamic animations. “The effect is to feel as though you’ve been transported directly into a mainframe where you can witness all of this computer magic happening in real time,” he says.
Advantages of Data Visualization
Data visualizations, otherwise known as charts, graphs and other types of information graphics, help communications professionals better relay information and educate their audiences. Most people comprehend information better visually than through lists of numbers. In an environment that’s increasingly data driven, savvy PR pros now turn to data visualization to help deliver corporate and brand messages.
Clearly, real-time data visualizations help organizations respond more quickly to new information and emerging trends, a critical ability in today’s fast-paced business environment.
Such data tools can improve communications and alignment between marketing and sales teams by showing the current status of leads, says Karri Bishop at Visme. “With one glance, the sales team can clearly see where potential blocks are occurring on their end and address them quickly, further improving their understanding of marketing’s contribution to their pipelines,” Bishop writes.
Follow Recommended Best Practices
With the rise of big data, data visualizations are more useful than ever. However, a hastily produced image won’t suffice and may even misinform or confuse viewers. Careful research and design are crucial for developing a visual that is eye-catching, informative and factually accurate. It’s crucial to select the appropriate type data visualization and to follow other best practices.
Data visualization, sometimes called “dataviz,” is one of the most critical skills for marketers to understand at least at a basic level, recommends Clare McDermott, co-founder and head of strategy at Mantis Research. Simplicity is probably the most important practice. Chose clarity over cleverness. “Simplicity is much more credible and appreciated than overly ornate (and opaque) visualizations, McDermont writes for the Content Marketing Institute.
Bottom Line: As data reporting and analysis tools become more sophisticated, real-time data visualizations may revolutionize corporate communications. PR and marketing will rely more on data analysis and data analytics will become even more valuable.

William J. Comcowich founded and served as CEO of CyberAlert LLC, the predecessor of Glean.info. He is currently serving as Interim CEO and member of the Board of Directors. Glean.info provides customized media monitoring, media measurement and analytics solutions across all types of traditional and social media.